A study of obesity risk in children in a head start program used a food score calculated from a 45-question food survey to predict body mass index (BMI) percentile in these children 18 months after the initial survey. The study enrolled 20 children. The researchers used a linear regression model for the prediction of BMI percentile. The food scores ranged from 45 to 245. 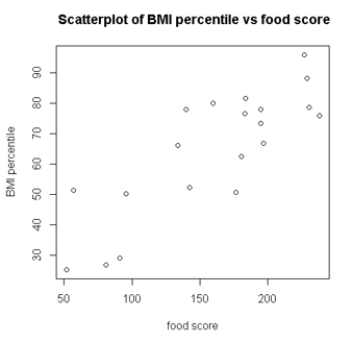 Which feature, supported by the scatterplot, is important to determine if a linear regression model can be used?
A) scatter of points around a straight line
B) even spread at each value of food score
C) correlation between BMI percentiles for subjects with similar food scores
D) options (a) and (b) only
Correct Answer:
Verified
Q17: You can visit the official website
Q18: You can visit the official website
Q19: The scatterplot below suggests a linear
Q20: The scatterplot below suggests a linear
Q21: The following is a scatterplot of a
Q23: A study of obesity risk in children
Q24: A study of obesity risk in children
Q25: A study of obesity risk in children
Q26: A study of obesity risk in children
Q27: The following is a scatterplot of a
Unlock this Answer For Free Now!
View this answer and more for free by performing one of the following actions

Scan the QR code to install the App and get 2 free unlocks

Unlock quizzes for free by uploading documents