Annual estimates of the population in a certain city from 1999 (t = 1) onward are shown in the time series graph below. 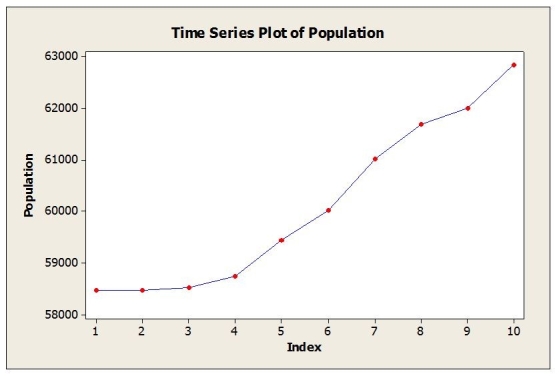 a. Identify the dominant time series component(s) in the data.
b. Below are the results from fitting a linear trend model to the data. Use this model to estimate the population in this city for 2008 (t = 10). 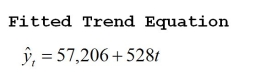 c. Below are the results from fitting a quadratic trend model to the data. Use this model to estimate the population in this city for 2008 (t = 10).
 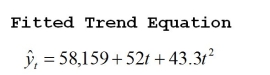 d. The actual population estimate for 2008 is 62,828. Which model does better? Why?
Correct Answer:
Verified
b. 62,486
c. 63,009
d...
View Answer
Unlock this answer now
Get Access to more Verified Answers free of charge
Q6: Monthly closing stock prices, adjusted for dividends,
Q7: Consider the following to answer the question(s)
Q8: Quarterly sales data (in $10,000) for a
Q9: The following table shows actual sales values
Q10: Daily closing stock prices for Kyocera Corporation
Q12: A large automobile parts supplier keeps track
Q13: Consider the following to answer the question(s)
Q14: Consider the following to answer the question(s)
Q15: Annual estimates of the population in the
Q16: Consider the following to answer the question(s)
Unlock this Answer For Free Now!
View this answer and more for free by performing one of the following actions

Scan the QR code to install the App and get 2 free unlocks

Unlock quizzes for free by uploading documents