A consumer research group investigating the relationship between the price of meat (per kilogram) and the fat content (grams) gathered data that produced the following scatterplot. 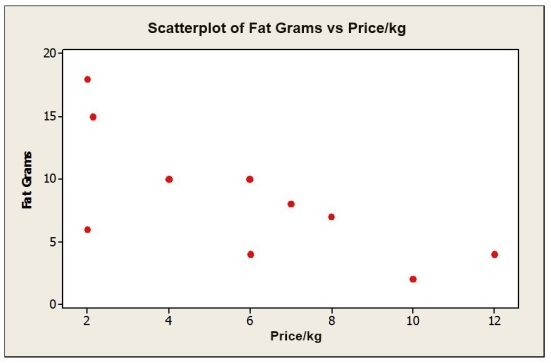 a. Describe the association between the price of meat and fat content.
b. Estimate the correlation.
c. If the point in the lower left hand corner ($2.00 per kilogram, 6 grams of fat) is removed, would the correlation become stronger, weaker, or remain the same? Explain.
Correct Answer:
Verified
View Answer
Unlock this answer now
Get Access to more Verified Answers free of charge
Q1: Consider the following to answer the question(s)
Q2: Based on the scatterplots shown below, describe
Q3: Based on the scatterplots shown below, describe
Q4: A supermarket chain gathers data on the
Q5: Consider the following to answer the question(s)
Q7: Shown below is a correlation table showing
Q9: Shown below is a correlation table showing
Q10: In discussing how its customers use online
Q11: Consider the following to answer the question(s)
Q11: The following scatterplot shows a relationship between
Unlock this Answer For Free Now!
View this answer and more for free by performing one of the following actions

Scan the QR code to install the App and get 2 free unlocks

Unlock quizzes for free by uploading documents