The diagram below shows upper and lower sums for the function 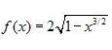 using 4 subintervals. Use upper and lower sums to approximate the area of the region using the 4 subintervals.
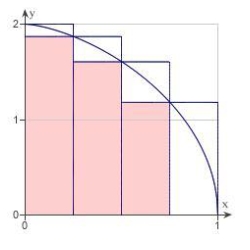
A) lower: 1.166 ; upper: 1.666
B) lower: 4.664 ; upper: 6.664
C) lower: 2.332 ; upper: 3.332
D) lower: 0.916 ; upper: 1.916
Correct Answer:
Verified
Q1: Use the properties of summation and Theorem
Q2: Use the limit process to find the
Q3: Use the summation formulas to rewrite the
Q4: Use the properties of summation and Theorem
Q5: Use left endpoints and 10 rectangles to

Unlock this Answer For Free Now!
View this answer and more for free by performing one of the following actions

Scan the QR code to install the App and get 2 free unlocks

Unlock quizzes for free by uploading documents