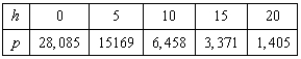
A meteorologist measures the atmospheric pressure P (in kilograms per square meter) at altitude h (in kilometers) . The data are shown below. Use the regression capabilities of the graphing utility to find a linear model for the revised data points obtained by plotting the points 
A) 
B) 
C) 
D) 
E) 
Correct Answer:
Verified
Q1: The graph of a function f is
Q2: The graph of f is shown below.
Q3: The graph of a function f is
Q5: The graph of a function f is
Q6: Sketch a graph of the function
Q7: Analyze and sketch a graph of the
Q8: Analyze and sketch a graph of the
Q9: The graph of f is shown below.
Q10: Determine the slant asymptote of the graph
Q11: Analyze and sketch a graph of the
Unlock this Answer For Free Now!
View this answer and more for free by performing one of the following actions

Scan the QR code to install the App and get 2 free unlocks

Unlock quizzes for free by uploading documents