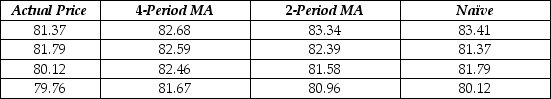
The table below shows the closing daily stock prices for Kyopera Corporation for September 2 through September 5, 2016, as well as 4-day moving average, 2-day moving average and naïve forecasts. Calculate the MAD and MSE for each of the three types of forecasts. Which is the best?
Correct Answer:
Verified
MAD (...
View Answer
Unlock this answer now
Get Access to more Verified Answers free of charge
Q1: Monthly closing stock prices, adjusted for dividends,
Q2: Consider the following to answer the question(s)
Q3: A large automobile parts supplier keeps track
Q5: Consider the following to answer the question(s)
Q6: Consider the following to answer the question(s)
Q7: Daily closing stock prices for Kyopera Corporation
Q8: Consider the following to answer the question(s)
Q9: Consider the following to answer the question(s)
Q10: Annual estimates of the population in the
Q11: Annual estimates of the population in the
Unlock this Answer For Free Now!
View this answer and more for free by performing one of the following actions

Scan the QR code to install the App and get 2 free unlocks

Unlock quizzes for free by uploading documents