Consider the graph of r(t) , the rate of change in the price of a technology stock, during the first 55 days of trading of 2003. Using the information present below, label each region as representing positive or negative change in price. 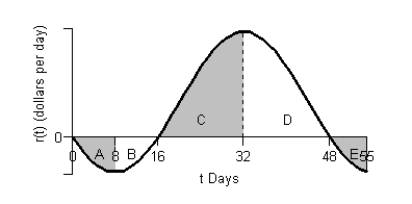

A) 
B) 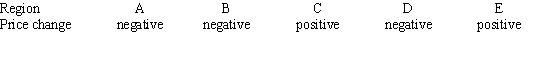
C) 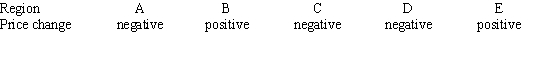
D) 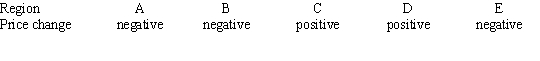
E) 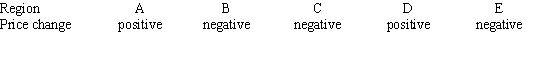
Correct Answer:
Verified
Q2: Consider the graph of f(t). 
Q3: Consider the graph of f(t).
Q4: Scientists can model the change in snow
Q5: Suppose the graph shows the energy usage
Q6: Using data from the U.S. Bureau of
Q8: Suppose the rate of change of the
Q9: Suppose the graph shows the energy usage
Q10: The function Q11: A program to protect a species of Q12: Consider the graph of f(t). ![]()
Unlock this Answer For Free Now!
View this answer and more for free by performing one of the following actions

Scan the QR code to install the App and get 2 free unlocks

Unlock quizzes for free by uploading documents