In its report to stockholders, a certain manufacturing company reported its total cost and revenue functions using the graphs given below: 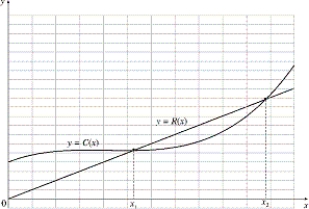 (a) Using the graph, sketch each of the following as a function of the quantity produced, x.(i) Marginal cost
(ii) Marginal revenue
(iii) Profit
(b) What is the significance of ? ?
(c) What is the meaning of ?
(d) Describe in words how the marginal cost changes as the quantity produced increases.(e) Explain the economic significance, in terms of marginal cost, of the point where the concavity of the cost function changes.
Correct Answer:
Verified
View Answer
Unlock this answer now
Get Access to more Verified Answers free of charge
Q112: Find the value of the limit
Q113: Find the value of the limit
Q114: The cost of operating a bus
Q115: A certain company has cost function
Q116: Find the value of the limit
Q118: Find the value of the limit
Q119: Find each of the following limits
Q120: A school band decides to raise with
Q121: Find the value of the limit
Q122: Explain why L'Hospital's Rule is not
Unlock this Answer For Free Now!
View this answer and more for free by performing one of the following actions

Scan the QR code to install the App and get 2 free unlocks

Unlock quizzes for free by uploading documents