 Figure 43.3
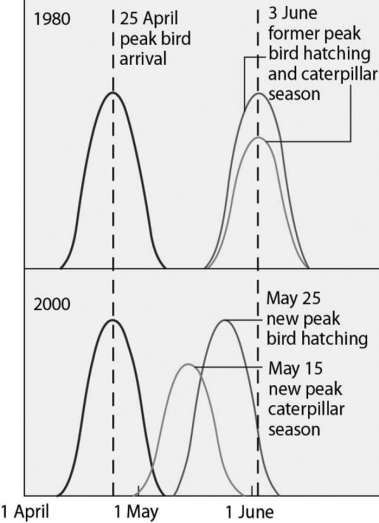
Use the graph in Figure 43.3 and the information provided in the paragraph below to answer the following questions.
Flycatcher birds that migrate from Africa to Europe feed their nestlings a diet that is almost exclusively moth caterpillars. The graph in Figure 43.3 shows the mean (peak) dates of bird arrival, bird hatching, and caterpillar season for the years 1980 and 2000.
-Your friend is wary of environmentalists' claims that climate change could lead to major biological change on Earth. Which of the following statements should you use to support the biological predictions associated with climate change?
A) We know that atmospheric carbon dioxide has increased over the past 150 years.
B) Through measurements and observations, we know that CO₂ levels and temperature fluctuations are directly correlated, even in prehistoric times.
C) Hundreds of organisms have already shifted in distribution as a result of warming that has occurred over the last 100 years.
D) Sea levels will likely fall, displacing as much as 50% of the world's human population.
Correct Answer:
Verified
Q62: Q63: Which of the following strategies would most Q63: Which of the following is a consequence Q64: How should the scientist draw a graph Q67: Of the following statements about protected areas Q68: One characteristic that distinguishes a population in Q68: The main cause of the increase in Q70: What is the single greatest threat to Q71: The scientist wishes to summarize the data Q72: Please use the following information to answer![]()
Unlock this Answer For Free Now!
View this answer and more for free by performing one of the following actions

Scan the QR code to install the App and get 2 free unlocks

Unlock quizzes for free by uploading documents