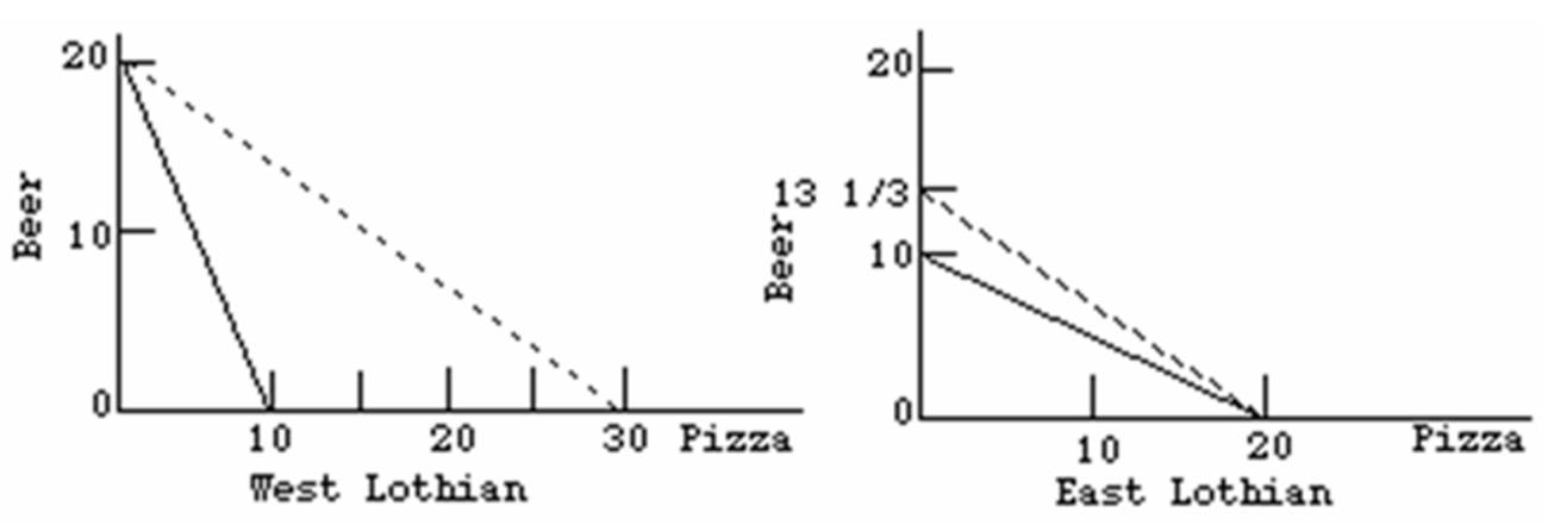
-Refer to the above diagrams.The solid lines are production possibilities curves;the dashed lines are trading possibilities curves.The trading possibilities curves imply that:
A) both countries are experiencing an excess of exports over imports which results in economic growth.
B) the domestic production possibilities curves entail unemployment and/or the domestic misallocation of resources.
C) world resources will be allocated more efficiently if the two nations specialize and trade in accordance with comparative advantage.
D) both nations will be worse off as a result of international specialization and trade.
Correct Answer:
Verified
Q31: The data embodied in the below diagrams
Q32: Given the following production possibilities schedules,it can
Q33: The production possibilities curves below suggest that:
Q37: The following shows the Production possibilities tables
Q38: The following is the Production possibilities data
Q41: In the theory of comparative advantage, a
Q41: Refer to the data below.Assume that before
Q44: According to the principle of comparative advantage,
Q45: The impact of increasing, as opposed to
Q47: The following information is about the cost
Unlock this Answer For Free Now!
View this answer and more for free by performing one of the following actions

Scan the QR code to install the App and get 2 free unlocks

Unlock quizzes for free by uploading documents