Refer to the diagrams below. The solid lines are production possibilities curves; the dashed lines are trading possibilities curves. The trading possibilities curves suggest that the terms of trade are: 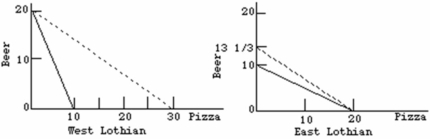
A) 1.5 beers for 1 pizza.
B) 1 beer for 2 pizzas.
C) 2 beers for 1 pizza.
D) 1 beer for 1.5 pizzas.
Correct Answer:
Verified
Q42: Production possibilities data for two countries,Alpha and
Q47: The data given is for two hypothetical
Q47: Refer to the data below. Assume that
Q51: The data given is for two hypothetical
Q55: Refer to the tables below. Which of
Q59: Production possibilities data for Gamma and Sigma.All
Q63: The following information is about the cost
Q66: Free trade based on comparative advantage is
Q72: The "gain" from international trade is:
A)increased employment
Q76: The law of increasing opportunity costs:
A)applies to
Unlock this Answer For Free Now!
View this answer and more for free by performing one of the following actions

Scan the QR code to install the App and get 2 free unlocks

Unlock quizzes for free by uploading documents