Exhibit 9.5
The following questions are based on the description and spreadsheet below.
An analyst has identified 3 independent variables (X1, X2,X3) which might be used to predict Y. He has computed the regression equations using all of the variables and the results are summarized in the following table. 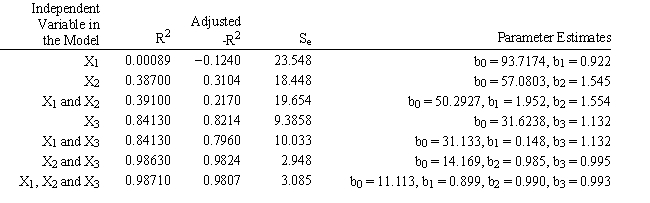
-Refer to Exhibit 9.5. Predict the mean value based on (X1, X2, X3) = (3, 32, 50). Use the best predictive model based on data from the table.
Correct Answer:
Verified
Q67: The company would like to build a
Q68: Exhibit 9.3
The following questions are based on
Q69: The standard error measures the
A) variability in
Q70: Exhibit 9.1
The following questions are based on
Q71: The adjusted R2 statistic
A) is equal to
Q73: Exhibit 9.1
The following questions are based on
Q74: Exhibit 9.2
The following questions are based on
Q75: Exhibit 9.2
The following questions are based on
Q76: Exhibit 9.6
The partial regression output below applies
Q77: Regression analysis is a modeling technique
A) that
Unlock this Answer For Free Now!
View this answer and more for free by performing one of the following actions

Scan the QR code to install the App and get 2 free unlocks

Unlock quizzes for free by uploading documents