Exhibit 11.9
The following questions use the data below.
Joe's Sporting Goods wants to forecast quarterly sales figures using a linear trend model. The store has collected 12 quarters of data and needs your help to analyze the data. The relevant regression output is in the following table. 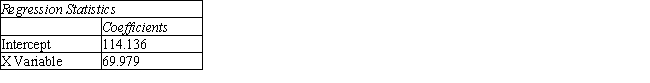
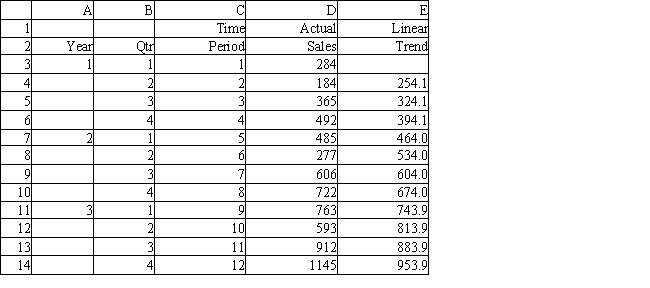
-Refer to Exhibit 11.9. What is the Input Y Range in the Regression command settings dialog box?
A) B3:B14
B) C3:C14
C) D3:D14
D) B3:D14
Correct Answer:
Verified
Q79: Why might a forecaster calculate MSE values
Q80: Exhibit 11.7
The following questions use the data
Q81: As the number of periods in the
Q82: Exhibit 11.8
The following questions use the data
Q83: Exhibit 11.11
The following questions use the data
Q85: Exhibit 11.1
The following questions use the data
Q86: Exhibit 11.23
The following questions use the data
Q87: Exhibit 11.16
The following questions use the data
Q88: Exhibit 11.22
The following questions use the data
Q89: Exhibit 11.4
The following questions use the data
Unlock this Answer For Free Now!
View this answer and more for free by performing one of the following actions

Scan the QR code to install the App and get 2 free unlocks

Unlock quizzes for free by uploading documents