The following graph is a ____________. 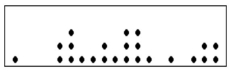
A) Dot plot
B) Stem-and-leaf diagram
C) Box plot
D) Contingency table
Correct Answer:
Verified
Q21: In a distribution, the second quartile corresponds
Q24: What does the interquartile range describe?
A)The range
Q25: The interquartile range is graphically presented in
Q26: A dot plot shows _.
A) The general
Q27: A dot plot is best applied for
Q32: In the following set of data:
Q33: A dot plot is best applied when
Q34: Percentiles divide a distribution into _.
A)2 equal
Q39: Quartiles divide a distribution into _.
A)2 equal
Q49: If the coefficient of skewness is equal
Unlock this Answer For Free Now!
View this answer and more for free by performing one of the following actions

Scan the QR code to install the App and get 2 free unlocks

Unlock quizzes for free by uploading documents