Refer to the following breakdown of responses to a survey of "How confident are you that you saved enough to retire?" 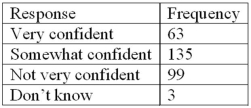 What type of chart should be used to show relative class frequencies?
A) A pie chart
B) A bar chart
C) A histogram
D) A frequency polygon
Correct Answer:
Verified
Q70: A frequency distribution for nominal data requires
Q70: Refer to the following breakdown of responses
Q73: Refer to the following breakdown of responses
Q76: Refer to the following breakdown of responses
Q77: Refer to the following breakdown of responses
Q78: Refer to the following breakdown of responses
Q79: Refer to the following breakdown of responses
Q80: Refer to the following breakdown of responses
Q86: For a frequency distribution of qualitative data,
Q98: For a frequency distribution of quantitative data,
Unlock this Answer For Free Now!
View this answer and more for free by performing one of the following actions

Scan the QR code to install the App and get 2 free unlocks

Unlock quizzes for free by uploading documents