The following frequency distribution shows the distribution of delivery times (in days) for swimstuff.com customer orders during the last month. 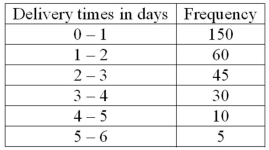 For 300 observations, our rule-of-thumb for number of classes would indicate 9 classes. In this case, what is the class interval and why would it be reasonable to use that class interval and only 6 classes?
Correct Answer:
Verified
View Answer
Unlock this answer now
Get Access to more Verified Answers free of charge
Q108: A data set has 200 observations. In
Q119: Refer to the following breakdown of responses
Q121: The following frequency distribution shows the distribution
Q122: The following frequency distribution shows the distribution
Q124: What is the difference between a frequency
Q126: The following frequency distribution shows the distribution
Q127: In a bar chart, why are there
Q127: The following frequency distribution shows the distribution
Q129: The following frequency distribution shows the distribution
Q130: What is the difference between a bar
Unlock this Answer For Free Now!
View this answer and more for free by performing one of the following actions

Scan the QR code to install the App and get 2 free unlocks

Unlock quizzes for free by uploading documents