The figure given below depicts the negatively sloped demand and positively sloped supply curves of wheat in a country. Figure 20.2 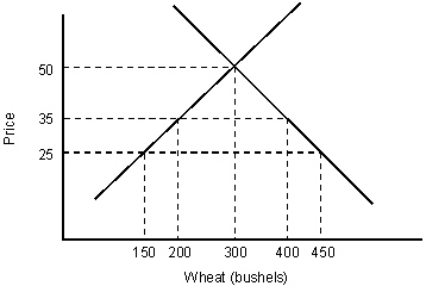 Refer to Figure 20.2.In the absence of international trade, what are the domestic equilibrium price and quantity?
A) $30 and 200 bushels
B) $50 and 400 bushels
C) $30 and 400 bushels
D) $50 and 300 bushels
E) $25 and 150 bushels
Correct Answer:
Verified
Q43: The figure below shows the demand (D)and
Q44: The figure given below depicts the negatively
Q45: The figure given below depicts the negatively
Q46: The figure below shows the demand (D)and
Q48: The figure given below depicts the negatively
Q49: By restricting the amount of a good
Q49: The figure below shows the demand (D)and
Q50: The figure given below depicts the negatively
Q52: The figure given below depicts the negatively
Q56: The figure below shows the demand (D)
Unlock this Answer For Free Now!
View this answer and more for free by performing one of the following actions

Scan the QR code to install the App and get 2 free unlocks

Unlock quizzes for free by uploading documents