The table below shows the distribution of income in the U.S.in the year 1978. Table 19.1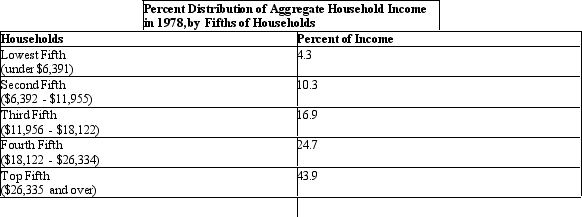 If a Lorenz curve is drawn using the data in Table 19.1, it will:
A) coincide with the line of perfect equality.
B) be a L-shaped curve.
C) bow above the line of perfect equality.
D) bow down below the line of perfect equality.
E) be a rectangular shaped curve.
Correct Answer:
Verified
Q3: The figure given below represents an imperfectly
Q4: Empirical observations validate that the Gini co-efficient
Q8: The table below shows the distribution of
Q8: Gini co-efficient is the:
A)area between the Lorenz
Q10: If 50 percent of the population receives
Q11: If the Gini coefficient for the United
Q13: The table below shows the distribution of
Q17: The figure given below represents an imperfectly
Q18: The figure given below represents an imperfectly
Q20: If the Gini co-efficient for any economy
Unlock this Answer For Free Now!
View this answer and more for free by performing one of the following actions

Scan the QR code to install the App and get 2 free unlocks

Unlock quizzes for free by uploading documents