The figures given below show the demand (D) and supply (S) curves of labor in two different markets. Figure 15.3 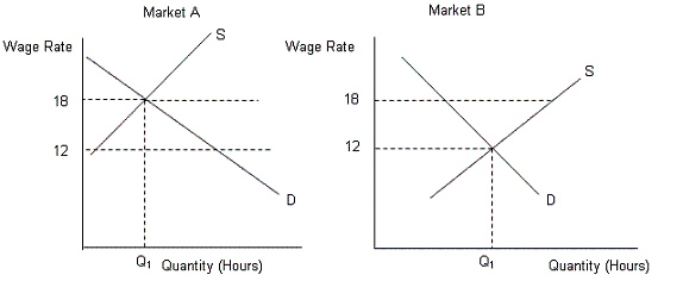 From Figure 15.3, calculate the amount of the wage differential.
A) $6
B) $18
C) $2
D) $20
E) $15
Correct Answer:
Verified
Q9: The labor demand curve is based on
Q11: It is said that a wage increase
Q12: The figure below shows the supply curve
Q12: Why does the labor market have more
Q13: The figure below shows the supply curve
Q19: The figure given below shows the demand
Q20: The figure below shows the supply curve
Q22: The following figures show the demand and
Q27: Why has the inequality of income become
Q32: Investment in human capital implies:
A)investment on machines,technological
Unlock this Answer For Free Now!
View this answer and more for free by performing one of the following actions

Scan the QR code to install the App and get 2 free unlocks

Unlock quizzes for free by uploading documents