The figure given below represents the saving function of an economy. Figure 9.1 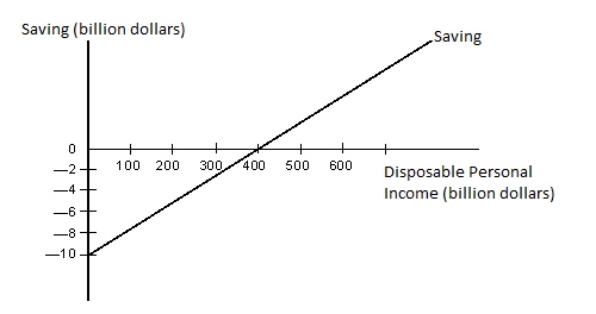 Refer to Figure 9.1.An increase in autonomous consumption would be illustrated by:
A) an upward shift of the saving function.
B) a downward shift of the saving function.
C) a downward shift of the corresponding consumption function.
D) a movement to the right along the saving function.
E) a movement to the left along the saving function.
Correct Answer:
Verified
Q13: The figure given below represents the saving
Q14: The figure given below represents the saving
Q15: A key assumption of the Keynesian model
Q16: The income net of taxes is called
Q17: Identify the correct statement with respect to
Q19: The part of the disposable income that
Q20: Which of the following is a stock
Q21: The consumption function becomes flatter if:
A)the average
Q22: The figure given below represents the consumption
Q23: Suppose total disposable income in Country X
Unlock this Answer For Free Now!
View this answer and more for free by performing one of the following actions

Scan the QR code to install the App and get 2 free unlocks

Unlock quizzes for free by uploading documents