The figure given below shows the consumption function of a household. Figure 9.2 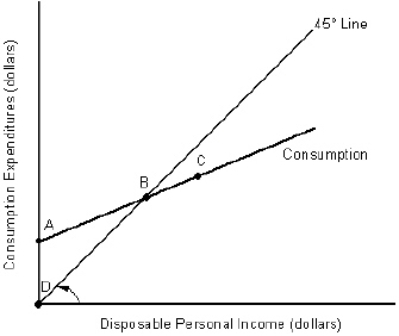 In Figure 9.2, consumption equals disposable income:
A) at point A only.
B) at point B only.
C) at point C only.
D) at points A and C only.
E) at all points on the consumption function.
Correct Answer:
Verified
Q33: The table given below reports the consumption
Q34: The figure given below represents the consumption
Q35: The figure given below shows the consumption
Q36: The figure given below represents the consumption
Q37: The figure given below represents the consumption
Q39: The figure given below represents the consumption
Q40: The table given below reports the consumption
Q41: As household wealth increases, it will experience
Q42: Which of the following factors will not
Q43: Any increase in autonomous consumption is associated
Unlock this Answer For Free Now!
View this answer and more for free by performing one of the following actions

Scan the QR code to install the App and get 2 free unlocks

Unlock quizzes for free by uploading documents