The figure given below represents the consumption function of a country. Figure 9.3 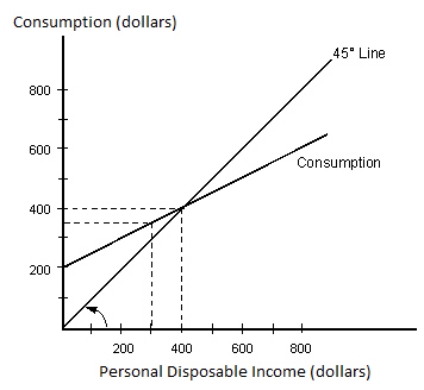 Refer to Figure 9.3.If the marginal propensity to consume is equal to 0.3, then:
A) autonomous consumption would decrease.
B) the total amount of dissaving would increase.
C) consumption spending would equal disposable income at an income level greater than $400.
D) consumption spending would equal disposable income at an income level less than $400.
E) consumption spending would equal disposable income at the same income level of $400.
Correct Answer:
Verified
Q21: The consumption function becomes flatter if:
A)the average
Q22: The figure given below represents the consumption
Q23: Suppose total disposable income in Country X
Q24: If a household experiences a $880 increase
Q25: A change in the marginal propensity to
Q27: As disposable income rises:
A)consumption falls as a
Q28: The figure given below represents the consumption
Q29: If a household's disposable income increases from
Q30: The figure given below shows the consumption
Q31: The table given below reports the consumption
Unlock this Answer For Free Now!
View this answer and more for free by performing one of the following actions

Scan the QR code to install the App and get 2 free unlocks

Unlock quizzes for free by uploading documents