The figure given below shows the aggregate expenditures function of an economy. Figure 9.5 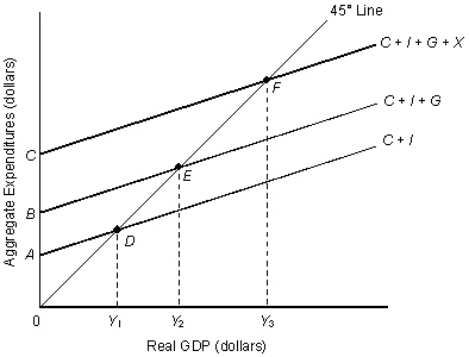 Refer to Figure 9.5.The amount of government spending is indicated by the distance _____.
A) Y1Y2
B) DE
C) Y2Y3
D) BC
E) AB
Correct Answer:
Verified
Q80: Which of the following would cause a
Q81: Other things equal, an increase in the
Q82: At the point where consumption equals disposable
Q83: As disposable income increases, consumption spending will
Q84: The average propensity to save (APS)is the
Q86: The aggregate expenditures function:
A)has the same slope
Q87: Changes in autonomous consumption will affect the
Q88: An increase in the marginal propensity to
Q89: Dissaving occurs when the consumption function lies
Q90: Consumption, saving, and wealth all represent stock
Unlock this Answer For Free Now!
View this answer and more for free by performing one of the following actions

Scan the QR code to install the App and get 2 free unlocks

Unlock quizzes for free by uploading documents