What is illustrated by this figure? 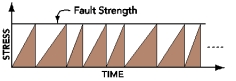
A) stress consistently increases through time
B) stress consistently decreases through time
C) as stress increases,the fault strength increases
D) stress increases until it matches the strength of the fault,and then stress decreases
Correct Answer:
Verified
Q1: What do the two stars near the
Q2: On this map of southeastern Asia and
Q3: On this map of southeastern Asia and
Q4: What is true about the earthquakes on
Q7: The earthquake location shown as the red
Q8: On this map of South America and
Q9: On this map of South America and
Q10: An earthquake generated on this type of
Q18: As it grows, a fault rupture that
Q20: The December 26, 2004 Indonesian earthquake occurred:
A)
Unlock this Answer For Free Now!
View this answer and more for free by performing one of the following actions

Scan the QR code to install the App and get 2 free unlocks

Unlock quizzes for free by uploading documents