A music teacher had noticed that some students went to pieces during exams. He wanted to test whether this performance anxiety was different for people playing different instruments. He took groups of guitarists, drummers and pianists (variable = 'Instru') and measured their anxiety (variable = 'Anxiety') during the exam. He also noted the type of exam they were performing (in the UK, musical instrument exams are known as 'grades' and range from 1 to 8) . He wanted to see whether the type of instrument played affected performance anxiety when controlling for the grade of the exam. The SPSS output below shows the final tables. Which of the following statements best reflects what these tables tells us? 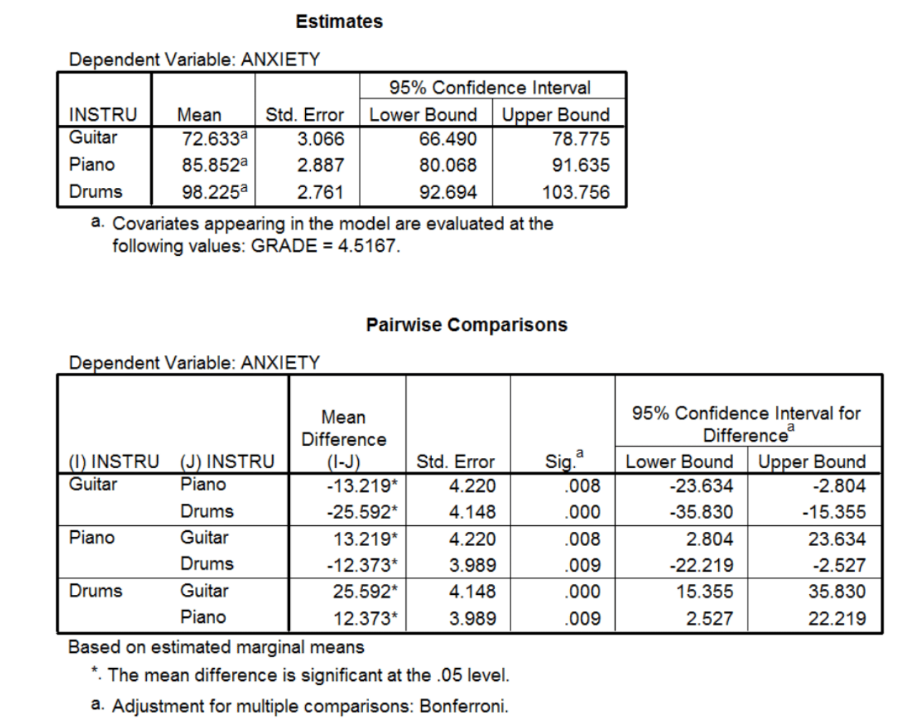
A) Guitarists were significantly less anxious than drummers, but were about as anxious as pianists, and drummers were about as anxious as pianists.
B) Guitarists were significantly less anxious than pianists and drummers, and drummers were significantly less anxious than pianists.
C) Guitarists, drummers and pianists were all about equally anxious.
D) Guitarists were significantly less anxious than pianists and drummers, and drummers were significantly more anxious than pianists.
Correct Answer:
Verified
Q15: What makes ANCOVA different from ANOVA?
A) ANCOVA
Q16: What is not true of the ANCOVA
Q17: In an experiment to study the effectiveness
Q18: What does the relationship of the data
Q19: A music teacher had noticed that some
Q21: When assumptions are violated in ANCOVA, which
Q22: In a study of favourable effects of
Q23: What does the effect size measure in
Q24: The following scatterplot represents the results of
Q25: The following scatterplot represents the results of
Unlock this Answer For Free Now!
View this answer and more for free by performing one of the following actions

Scan the QR code to install the App and get 2 free unlocks

Unlock quizzes for free by uploading documents