Consider the graph below. This is the graph of the results of an experimental learning condition as the independent variable and IQ as the covariate. What does the graph indicate? 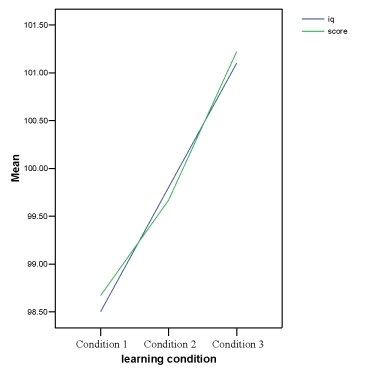
A) Although the independent variable has had an effect on the dependent variable, the covariate is the more likely explanation of effect.
B) The learning condition has altered IQ.
C) IQ has altered the learning condition.
D) Not enough information.
Correct Answer:
Verified
Q1: A health psychologist was interested in the
Q2: Which of the following is not considered
Q4: A scatterplot and a summary table for
Q5: What is an alternative way to model
Q6: Under what circumstances would you not consider
Q7: In an ANCOVA with one covariate and
Q8: Using the SPSS output below, which of
Q9: Adjusted group means are
A) Means across all
Q10: What does ANCOVA allow the researcher to
Q11: A music teacher had noticed that some
Unlock this Answer For Free Now!
View this answer and more for free by performing one of the following actions

Scan the QR code to install the App and get 2 free unlocks

Unlock quizzes for free by uploading documents