Figure 10-9 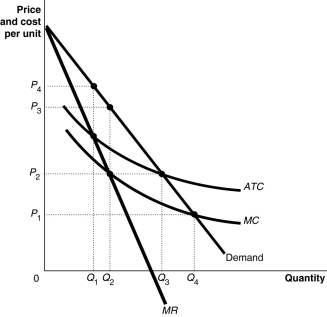 Figure 10-9 shows the cost and demand curves for the Erickson Power Company.
-Refer to Figure 10-9.What is the economically efficient output level and what is the price at that level?
A) Q4,P1
B) Q3,P2
C) Q2,P2
D) Q2,P3
Correct Answer:
Verified
Q136: The standards used by the Department of
Q137: Figure 10-9 Q145: Figure 10-10 Q209: Figure 15-14 Q210: A possible advantage of a horizontal merger Q230: In regulating a natural monopoly, the price Q262: A product's price approaches its marginal cost Q265: Holding everything else constant, government approval of Q269: The U.S.government would never approve a proposed Q270: Consider two industries, industry Q and industry Unlock this Answer For Free Now! View this answer and more for free by performing one of the following actions Scan the QR code to install the App and get 2 free unlocks Unlock quizzes for free by uploading documents![]()
![]()
![]()

