Refer to the information provided in Figure 12.3 below to answer the questions that follow. 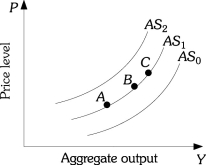 Figure 12.3
-Refer to Figure 12.3.An increase in aggregate supply is represented by
A) a movement from Point B to Point A along AS1.
B) a movement from Point B to Point C along AS1.
C) a shift from AS1 to AS2.
D) a shift from AS1 to AS0.
Correct Answer:
Verified
Q10: The aggregate supply curve
A) is the sum
Q20: When the aggregate supply curve is horizontal,
A)
Q23: Which of the following would cause the
Q24: An increase in aggregate demand when the
Q27: Coal is used as a source of
Q28: Refer to the information provided in Figure
Q38: A movement down the aggregate supply curve
Q39: If input prices changed at exactly the
Q47: An oil price increase would
A) increase aggregate
Q71: An increase in the price of a
Unlock this Answer For Free Now!
View this answer and more for free by performing one of the following actions

Scan the QR code to install the App and get 2 free unlocks

Unlock quizzes for free by uploading documents