Figure 3-3 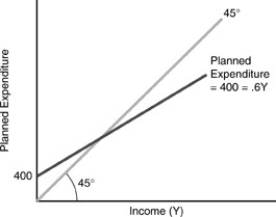
-In the figure above, equilibrium income is
A) 400.
B) 640.
C) 666.67.
D) 1,000.
E) 2,400.
Correct Answer:
Verified
Q6: A variable which is independent of the
Q44: On a diagram of the consumption function
Q47: Suppose a = 50,c = 0.8,and T
Q52: Saving is positive for all levels of
Q56: If Y = $200 billion,c = 0.75,autonomous
Q58: The slope of the planned expenditure line
Q60: Total income is always equal to _
Q75: Which element of total planned expenditure is
Q81: Income on the horizontal axis at which
Q102: The one type of expenditure that we
Unlock this Answer For Free Now!
View this answer and more for free by performing one of the following actions

Scan the QR code to install the App and get 2 free unlocks

Unlock quizzes for free by uploading documents