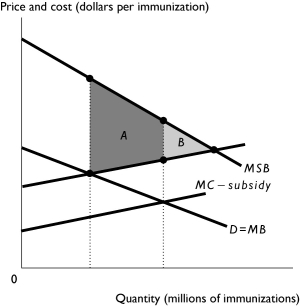
-The figure above shows the market for annual influenza immunizations the United States.Area A is the
A) total deadweight loss when there is not the illustrated subsidy.
B) remaining deadweight loss when there is the illustrated subsidy.
C) gain in efficiency from the illustrated subsidy.
D) loss in efficiency from the illustrated subsidy.
E) consumer surplus with the illustrated subsidy.
Correct Answer:
Verified
Q223: In the figure above,when the market is
Q224: Q225: Marginal social benefit equals Q226: In the figure above,if a pollution tax Q227: When Ronald takes another economics class,other people Q229: In the figure above,when the market is Unlock this Answer For Free Now! View this answer and more for free by performing one of the following actions Scan the QR code to install the App and get 2 free unlocks Unlock quizzes for free by uploading documents![]()
A) marginal external benefit.
B)

