The graph shows the activity R as a function of the time t for three radioactive samples. Rank the samples according to their half-lives, shortest to longest. 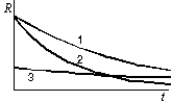
A) 1, 2 ,3
B) 1, 3, 2
C) 2, 1, 3
D) 2, 3, 1
E) 3, 1, 2
Correct Answer:
Verified
Q4: If a nucleus has mass M, Z
Q8: The isotopes of an element:
A)cannot be separated
Q17: A nucleus with a mass number of
Q22: Radioactive element A decays to the stable
Q23: A large collection of nuclei are undergoing
Q25: The half-life of a radioactive isotope is
Q26: Let A be the mass number and
Q38: Radioactive 90Sr has a half-life of 30
Q39: The half-life of a radioactive substance is:
A)half
Q40: The half-life of a given nuclear
Unlock this Answer For Free Now!
View this answer and more for free by performing one of the following actions

Scan the QR code to install the App and get 2 free unlocks

Unlock quizzes for free by uploading documents