Figure 4-3 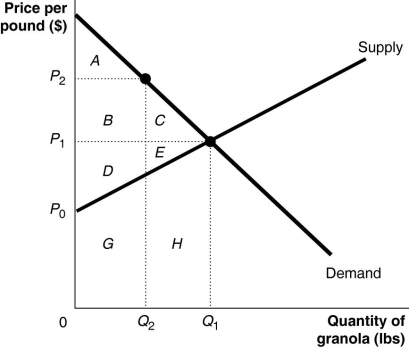 Figure 4-3 shows the market for granola.The market is initially in equilibrium at a price of P1 and a quantity of Q1.Now suppose producers decide to cut output to Q2 in order to raise the price to P2.
-Refer to Figure 4-3.What area represents the deadweight loss at the equilibrium price of P1?
A) C + E + H
B) G + H
C) C + E
D) There is no deadweight loss at the price of P1.
Correct Answer:
Verified
Q66: What area on a supply and demand
Q72: What is marginal cost? Which curve is
Q75: Figure 4-3 Q75: When the marginal benefit equals the marginal Q76: The additional cost to a firm of Unlock this Answer For Free Now! View this answer and more for free by performing one of the following actions Scan the QR code to install the App and get 2 free unlocks Unlock quizzes for free by uploading documents![]()

