Multiple Choice
Exhibit 2-6 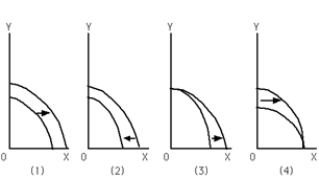
-Refer to Exhibit 2-6.Which graph depicts the result of an increase in the number of illegal immigrants entering the country?
A) (1)
B) (2)
C) (3)
D) (4)
E) none of the above
Correct Answer:
Verified
Related Questions

