A sociologist studies the relationship between a district's average score on a standardized test for 10th-grade students (y),the average school expenditures per student (x1 in $1,000s),and an index of the socioeconomic status of the district (x2).The following model is estimated:  .A portion of the regression results is shown in the accompanying table.
 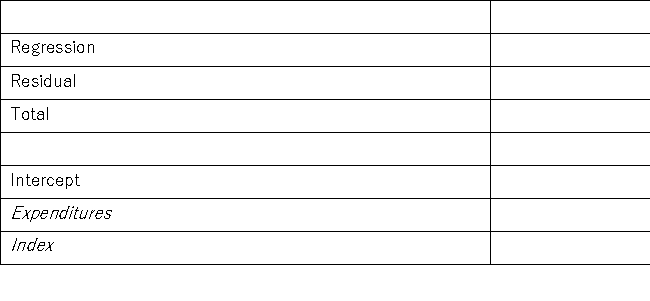 a.Predict a district's average test score if average expenditures are $4,500 and the district's social index is 8.
b.Interpret the slope coefficient attached to Expenditures.
c.Calculate the standard error of the estimate.
d.Calculate and interpret the coefficient of determination.
e.Calculate the adjusted R2.
Correct Answer:
Verified
View Answer
Unlock this answer now
Get Access to more Verified Answers free of charge
Q130: Which of the following is the relationship
Q131: The following ANOVA table was obtained when
Q132: The following portion of regression results was
Q133: The following portion of regression results was
Q134: An investment analyst wants to examine the
Q135: When estimating a multiple regression model,the following
Q136: John is an undergraduate business major studying
Q138: Consider the following information regarding a response
Q139: Consider the following sample data: 
Q140: Consider the following sample data:
Unlock this Answer For Free Now!
View this answer and more for free by performing one of the following actions

Scan the QR code to install the App and get 2 free unlocks

Unlock quizzes for free by uploading documents