A university has six colleges and takes a poll to gauge student support for a tuition increase.The university wants to ensure each college is represented fairly.The below table shows the observed number of students who participate in the poll from each college and the actual proportion of students in each college. 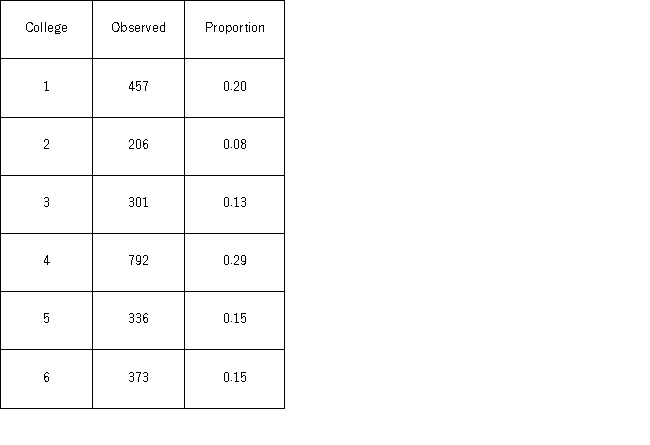 Using the p-value approach and α = 0.01,the decision and conclusion are ___________________________________.
A) do not reject the null hypothesis;all proportions are equal to 0.20
B) do not reject the null hypothesis;we cannot conclude that not all of the proportions are the same
C) reject the null hypothesis;at least one of the proportions is different from its hypothesized value
D) reject the null hypothesis;all of the proportions are not the same
Correct Answer:
Verified
Q54: In the following table,likely voters' preferences of
Q55: In the following table,likely voters' preferences of
Q56: A fund manager wants to know if
Q57: In the following table,individuals are cross-classified by
Q58: A university has six colleges and takes
Q60: A university has six colleges and takes
Q61: In the following table,individuals are cross-classified by
Q62: The following table shows the distribution of
Q63: In the following table,individuals are cross-classified by
Q64: The following table shows the distribution of
Unlock this Answer For Free Now!
View this answer and more for free by performing one of the following actions

Scan the QR code to install the App and get 2 free unlocks

Unlock quizzes for free by uploading documents