The following table summarizes selected statistics for two portfolios for a 10-year period ending in 2006.Assume that the risk-free rate is 4% over this period. 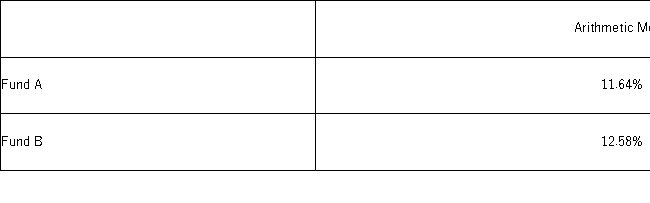 As measured by the Sharpe ratio,the fund with the superior risk-adjusted performance during this period is _________________________________________________________.
A) Fund A because it has a lower positive Sharpe ratio than Fund B
B) Fund B because it has a lower positive Sharpe ratio than Fund A
C) Fund A because it has a higher positive Sharpe ratio than Fund B
D) Fund B because it has a higher positive Sharpe ratio than Fund A
Correct Answer:
Verified
Q62: The advantage of using mean absolute deviation
Q65: The annual returns (in percent)for a sample
Q66: The annual returns (in percent)for a sample
Q66: The coefficient of variation is best described
Q67: A bowler's scores for a sample of
Q68: A bowler's scores for a sample of
Q73: As of September 30,2011,the earnings per share
Q74: What is(are)the characteristic(s)of the coefficient of variation?
A)
Q76: The mean return on equity (ROE) for
Q79: Professors at a local university earn an
Unlock this Answer For Free Now!
View this answer and more for free by performing one of the following actions

Scan the QR code to install the App and get 2 free unlocks

Unlock quizzes for free by uploading documents