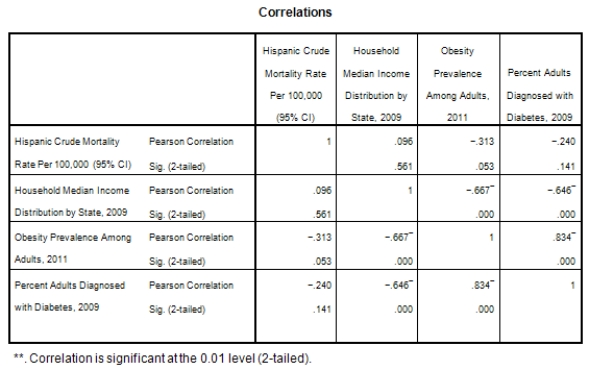
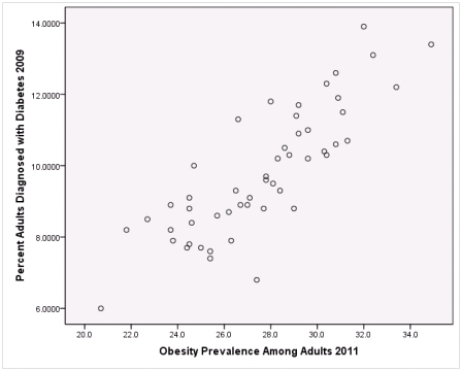
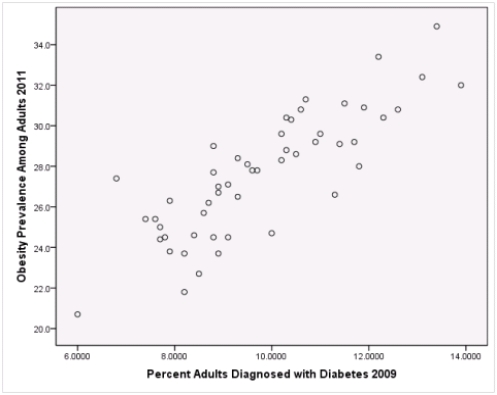
A recent study was done to assess factors that put Hispanic populations more at risk for obesity and related chronic diseases,such as diabetes and heart disease,than non-Hispanic populations.Data were collected on several factors,such as the crude morality rate of Hispanics,obesity prevalence,percent of adults diagnosed with diabetes,and median income at the state level.Pearson's Correlations were used to examine the strength of the relationship between obesity and the other variables,as a way of observing which characteristics were associated with high prevalence of obesity.In addition,a simple linear regression was used to model the relationship between diabetes and obesity.The results from SPSS are shown below. 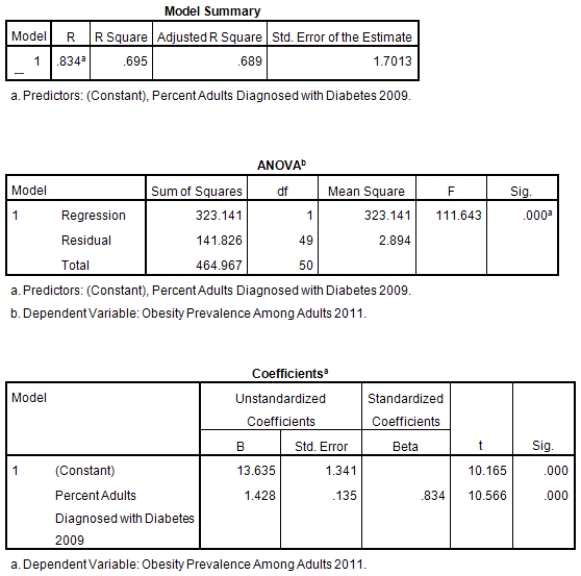
 Based on the results,is there a statistically significant relationship between diabetes and obesity rates?
A) Yes,the scatterplot shows a strong linear relationship,and the ANOVA model for testing that the slope of the regression line is zero versus the alternative that the slope is not zero is statistically significant.
B) You cannot tell because the preliminary analysis of the data indicate that there is not a strong enough relationship between obesity rates and diabetes rates to trust the results of the ANOVA modelfor testing the slope of the regression line is zero versus the alternative that the slope is not zero.
C) No,simple linear regression is not the appropriate statistical procedure for these data.Therefore,the results are incorrect.
Correct Answer:
Verified
Q75: In the National Football League (NFL),having an
Q76: For the 2009 NFL season,data are
Q77: A recent study was done to assess
Q78: A recent study was done to assess
Q79: A recent study was done to assess
Q81: Deborah's Dairy Market sells both cottage
Q82: The moisture in a wet mix of
Q83: The moisture in a wet mix of
Q84: The following scatter plot and SPSS output
Q85: The moisture in a wet mix of
Unlock this Answer For Free Now!
View this answer and more for free by performing one of the following actions

Scan the QR code to install the App and get 2 free unlocks

Unlock quizzes for free by uploading documents