The following figure shows the daily three-month treasury yield in September 2008. Refer to the following figure when answering the following questions.
Figure 10.1: Daily Three-Month Treasury Yield: September 2008 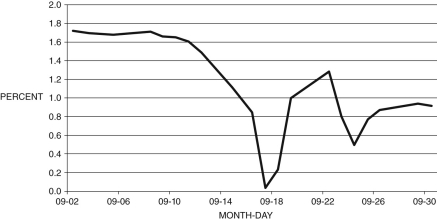
-Consider the data in Figure 10.1. What does the data for mid-September in this figure suggest?
A) Increasing investor confidence in the effectiveness of TARP led to smaller purchases of U.S. treasuries.
B) There was a rapid movement of assets from treasuries to stocks.
C) In the aftermath of the collapse of Lehman Brothers, investors fled to the safety of short-term treasuries.
D) Prices of gold declined in line with short-term treasury yields.
E) General Motors and Chrysler declared bankruptcy.
Correct Answer:
Verified
Q65: If reserve requirements are 3 percent and
Q66: In the recent financial crisis, the banks'
Q67: What is the industry Mr. McGuire advises
Q68: In the months following the collapse of
Q69: When the investment bank Bear Stearns collapsed,
Q71: If the value of this bank's investments
Q72: A significant cause of the 2008 financial
Q73: When all depositors converge on a bank
Q74: In the last months of 2008 following
Q75: In what year was the Federal Deposit
Unlock this Answer For Free Now!
View this answer and more for free by performing one of the following actions

Scan the QR code to install the App and get 2 free unlocks

Unlock quizzes for free by uploading documents