In the logistic growth curve depicted in Figure 46.6, as time goes on, what value would you expect N to approach? 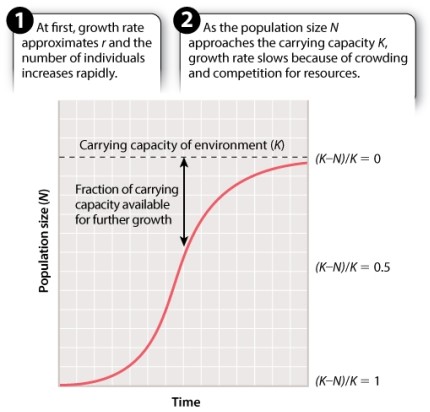
A) r
B) K
C) S
D) t
E) N
Correct Answer:
Verified
Q62: If you were a conservation biologist in
Q63: A scientist is studying a population of
Q64: In the experiments with moss patches described
Q65: A scientist is studying a population of
Q66: Consider the data in Figure 46.11
Q68: When sea turtle eggs hatch, predators gather
Q69: Phylogenies suggest that Anolis lizards colonized Hispaniola:
A)once.
B)twice.
C)five
Q70: An r-strategist will typically:
A)produce many offspring.
B)produce small
Q71: In the 1940s, biologist Adolph Murie studied
Q72: The figure below illustrates a life-history trade-off
Unlock this Answer For Free Now!
View this answer and more for free by performing one of the following actions

Scan the QR code to install the App and get 2 free unlocks

Unlock quizzes for free by uploading documents