Multiple Choice
Figure 6.1 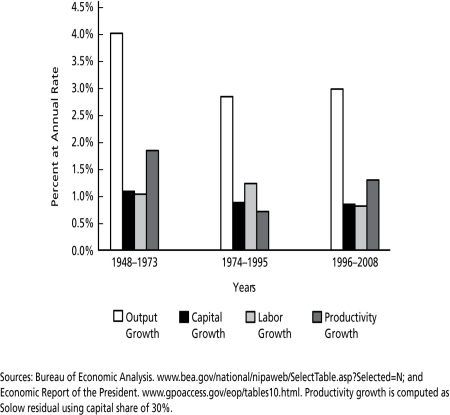
-According to Figure 6.1, the average annual rate of growth of the U.S. economy in the period 1996-2008 equalled ________.
A) 0.3 percent.
B) 3.0 percent.
C) 30 percent.
D) 300 percent.
Correct Answer:
Verified
Related Questions
Q2: Figure 6.1 Q4: The economic growth of the United States Q61: If productivity growth equals 3.0 percent,the contribution Q63: Productivity growth can be measured _. Q69: Figure 6.1 Q71: National output is a function of _. Unlock this Answer For Free Now! View this answer and more for free by performing one of the following actions Scan the QR code to install the App and get 2 free unlocks Unlock quizzes for free by uploading documents![]()
A)by dividing![]()
A)capital

