Determine whether the statement is true or false. If it is true, explain why it is true. If it is false, give an example to show why it is false.
If the data consist of two distinct points, then the least-squares line is just the line that passes through the two points.
A) It is true.
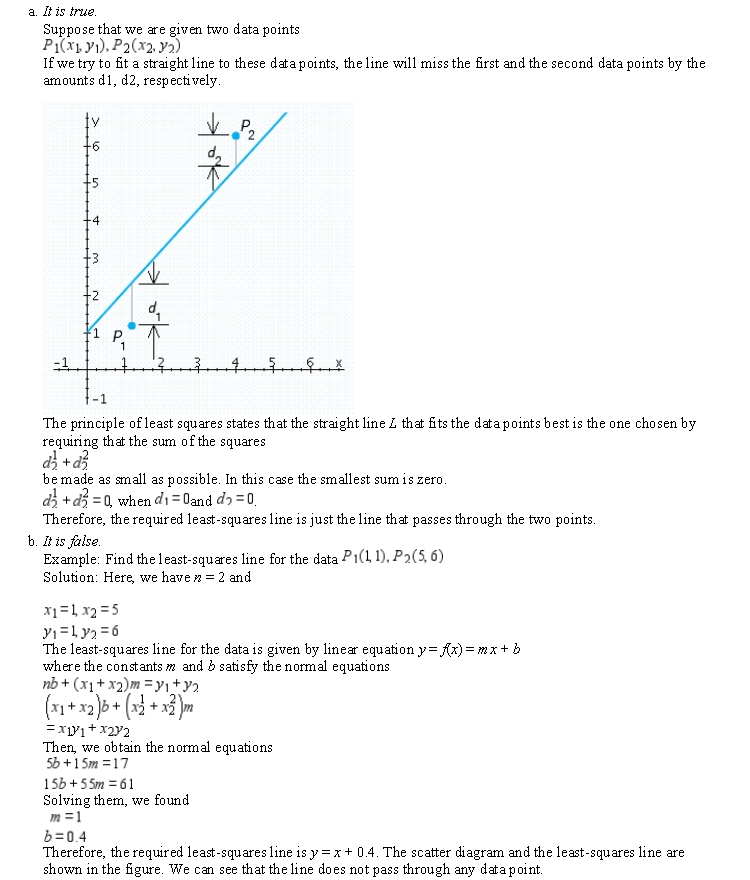
Suppose that we are given two data points 
If we try to fit a straight line to these data points, the line will miss the first and the second data points by the amounts d1, d2, respectively.
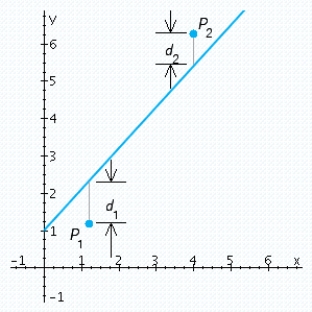
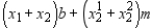
The principle of least squares states that the straight line L that fits the data points best is the one chosen by requiring that the sum of the squares 
Be made as small as possible. In this case the smallest sum is zero.  , when
  and
and  .
.
Therefore, the required least-squares line is just the line that passes through the two points.
B) It is false.
Example: Find the least-squares line for the data  Solution: Here, we have n = 2 and
The least-squares line for the data is given by linear equation y = f(x) = mx + b
Where the constants m and b satisfy the normal equations 
 Then, we obtain the normal equations
  Solving them, we found
  Therefore, the required least-squares line is y = x + 0.4. The scatter diagram and the least-squares line are shown in the figure. We can see that the line does not pass through any data point.
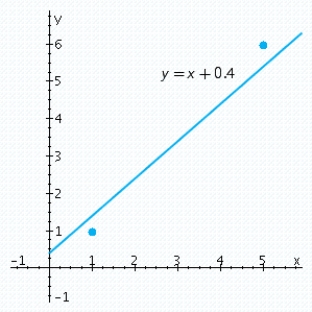
Correct Answer:
Verified
Q256: Draw a scatter diagram for the data
Q257: The accompanying data were compiled by the
Q258: According to industry sources, online banking is
Q259: The accompanying table gives the projected online
Q260: The size of the average farm in
Q262: With computer security always a hot-button issue,
Q263: Find the equation of the least-squares line
Q264: Find the equation of the least-squares line
Q265: The Census Bureau projections of male life
Q266: Find the equation of the least-squares line
Unlock this Answer For Free Now!
View this answer and more for free by performing one of the following actions

Scan the QR code to install the App and get 2 free unlocks

Unlock quizzes for free by uploading documents