Use the data and graph shown below for the following questions. 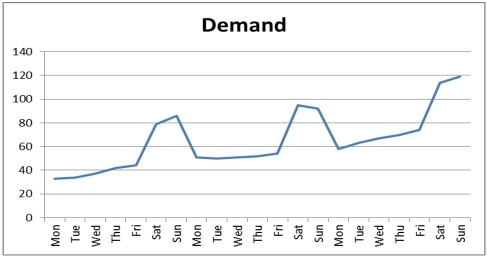
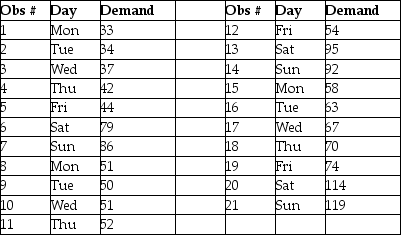
-Refer to the instruction above.What is the average demand for the second period?
A) 63.57
B) 50.71
C) 82.5
D) 93.5
Correct Answer:
Verified
Q16: Variations in demand that cannot be predicted
Q127: Table 14.13
The manager of a pizza shop
Q129: Table 14.13
The manager of a pizza shop
Q131: Use the data and graph shown below
Q132: _ is the prediction of future events
Q133: Barney took what he liked to call
Q133: Table 14.13
The manager of a pizza shop
Q134: Cyclical patterns arise from _ and _.
Q135: Table 14.13
The manager of a pizza shop
Q149: The local building supply store experienced what
Unlock this Answer For Free Now!
View this answer and more for free by performing one of the following actions

Scan the QR code to install the App and get 2 free unlocks

Unlock quizzes for free by uploading documents