Multiple Choice
 In the above graph,the shift from I to II was due to
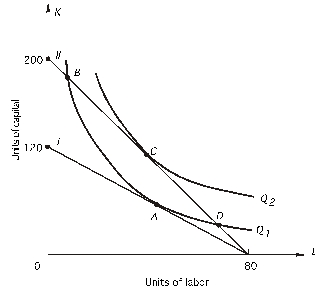
A) an increase in total cost.
B) an increase in the price of labor.
C) a decrease in the price of labor.
D) an increase in the price of capital.
E) a decrease in the price of capital.
Correct Answer:
Verified
Related Questions
Q67: If a firm is producing the level
Q72: If the marginal rate of technical substitution
Q74: In the graph below,the price of capital
Q75: A firm is using 500 units of
Q75: Following is a firm's expansion path.The price
Unlock this Answer For Free Now!
View this answer and more for free by performing one of the following actions

Scan the QR code to install the App and get 2 free unlocks

Unlock quizzes for free by uploading documents