
Intermediate Microeconomics and Its Application 12th Edition by Walter Nicholson,Christopher Snyder
النسخة 12الرقم المعياري الدولي: 978-1133189022Intermediate Microeconomics and Its Application 12th Edition by Walter Nicholson,Christopher Snyder
النسخة 12الرقم المعياري الدولي: 978-1133189022 تمرين 1
The following data show the production possibilities for a hypothetical economy during one year: 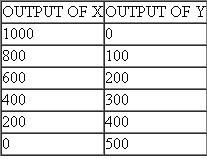 a. Plot these points on a graph. Do they appear to lie along a straight line? What is that straight line's production possibility frontier?
b. Explain why output levels of X = 400, Y = 200 or X = 300, Y = 300 are inefficient. Show these output levels on your graph.
c. Explain why output levels of X = 500, Y = 350 are unattainable in this economy.
d. What is the opportunity cost of an additional unit of X output in terms of Y output in this economy? Does this opportunity cost depend on the amounts being produced?
a. Plot these points on a graph. Do they appear to lie along a straight line? What is that straight line's production possibility frontier?b. Explain why output levels of X = 400, Y = 200 or X = 300, Y = 300 are inefficient. Show these output levels on your graph.
c. Explain why output levels of X = 500, Y = 350 are unattainable in this economy.
d. What is the opportunity cost of an additional unit of X output in terms of Y output in this economy? Does this opportunity cost depend on the amounts being produced?
التوضيح موثّق
موثّق
a) On the basis of the data given for a hypothetical economy, the production possibility frontier ( PPF ) for the year is shown below:  All the points in the graph lie along a straight line.
The straight line shape of the PPF curve signifies that the opportunity cost is constant as the production of different goods changes.
b) The output levels
 and
and 
 lie inside the PPF. These output levels can be produced but are productively inefficient because more of either or both the goods can be produced by using the existing economical resources.
 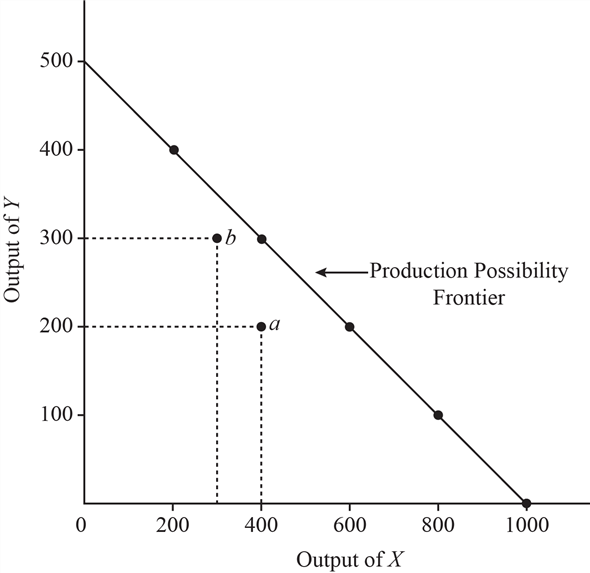 c) The output level
 and
and 
 0
0
lies outside the PPF. This output level is unattainable because it cannot be produced with the given, existing resources.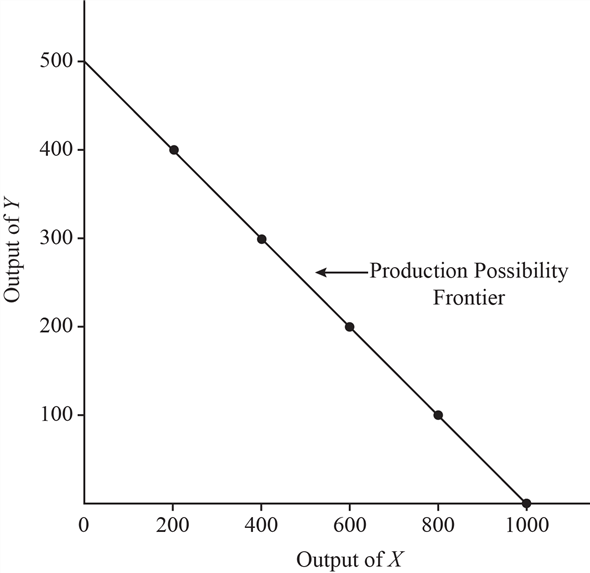 1
1
d) An increase in the production of good 2
2
leads to a decrease in the production of good 3
3
if there is no increase in productive resources. This is due to the transfer of resources from one good to another. The foregone production of good 4
4
is called the opportunity cost. Thus, producing 200 more units of good 5
5
costs 100 units of good 6
6
. That is: 7
7
Thus, the opportunity cost of producing one more unit of 8
8
is 9
9
.
Yes, opportunity cost does not depend upon the amount of two goods being produced. It is constant throughout the PPF.
All the points in the graph lie along a straight line.The straight line shape of the PPF curve signifies that the opportunity cost is constant as the production of different goods changes.
b) The output levels
and lie inside the PPF. These output levels can be produced but are productively inefficient because more of either or both the goods can be produced by using the existing economical resources. c) The output level and 0lies outside the PPF. This output level is unattainable because it cannot be produced with the given, existing resources.
1d) An increase in the production of good
2leads to a decrease in the production of good
3if there is no increase in productive resources. This is due to the transfer of resources from one good to another. The foregone production of good
4is called the opportunity cost. Thus, producing 200 more units of good
5costs 100 units of good
6. That is:
7Thus, the opportunity cost of producing one more unit of
8is
9.
Yes, opportunity cost does not depend upon the amount of two goods being produced. It is constant throughout the PPF.
Intermediate Microeconomics and Its Application 12th Edition by Walter Nicholson,Christopher Snyder
لماذا لم يعجبك هذا التمرين؟
أخرى 8 أحرف كحد أدنى و 255 حرفاً كحد أقصى
حرف 255


