
Ecology 6th Edition by Charles Krebs
النسخة 6الرقم المعياري الدولي: 978-0321688149Ecology 6th Edition by Charles Krebs
النسخة 6الرقم المعياري الدولي: 978-0321688149 تمرين 4
Plot the data in Table 1.1 graphically, with gross national product ( x -axis) versus total fertility rate ( y -axis). How tight is the relationship between these two variables? Discuss the reasons for the overall form of this relationship, and the reasons why there might be variation or spread in the data.
Reference Table 1.1:
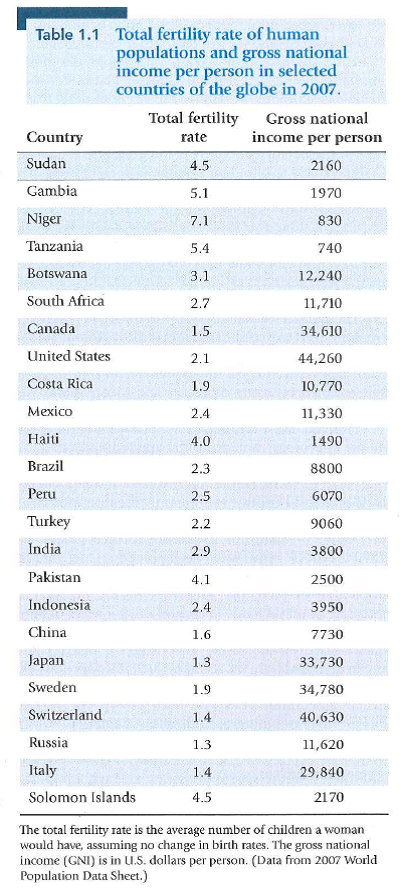
Reference Table 1.1:
التوضيح موثّق
موثّق
The following table lists data of twenty...
Ecology 6th Edition by Charles Krebs
لماذا لم يعجبك هذا التمرين؟
أخرى 8 أحرف كحد أدنى و 255 حرفاً كحد أقصى
حرف 255


