Accounting 26th Edition by Carl Warren,James Reeve,Jonathan Duchac
النسخة 26الرقم المعياري الدولي: 978-1285743615Accounting 26th Edition by Carl Warren,James Reeve,Jonathan Duchac
النسخة 26الرقم المعياري الدولي: 978-1285743615 تمرين 58
Solvency and profitability trend analysis
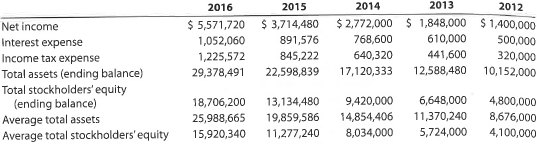
Crosby Company has provided the following comparative information:
You have been asked to evaluate the historical performance of the company over the last five years.
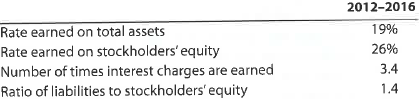
Selected industry ratios have remained relatively steady at the following levels for the last five years:
Instructions
1. Prepare four line graphs with the ratio on the vertical axis and the years on the horizontal axis for the following four ratios (rounded to one decimal place):
a. Rate earned on total assets
b. Rate earned on stockholders' equity
c. Number of times interest charges are earned
d. Ratio of liabilities to stockholders' equity
Display both the company ratio and the industry benchmark on each graph. That is, each graph should have two lines.
2. Prepare an analysis of the graphs in (1).
Crosby Company has provided the following comparative information:
You have been asked to evaluate the historical performance of the company over the last five years.
Selected industry ratios have remained relatively steady at the following levels for the last five years:
Instructions
1. Prepare four line graphs with the ratio on the vertical axis and the years on the horizontal axis for the following four ratios (rounded to one decimal place):
a. Rate earned on total assets
b. Rate earned on stockholders' equity
c. Number of times interest charges are earned
d. Ratio of liabilities to stockholders' equity
Display both the company ratio and the industry benchmark on each graph. That is, each graph should have two lines.
2. Prepare an analysis of the graphs in (1).
التوضيح موثّق
موثّق
Accounting 26th Edition by Carl Warren,James Reeve,Jonathan Duchac
لماذا لم يعجبك هذا التمرين؟
أخرى 8 أحرف كحد أدنى و 255 حرفاً كحد أقصى
حرف 255


