
Holt Modern Biology 1st Edition by John Postlethwait ,Janet Hopson
النسخة 1الرقم المعياري الدولي: 9780030651786Holt Modern Biology 1st Edition by John Postlethwait ,Janet Hopson
النسخة 1الرقم المعياري الدولي: 9780030651786 تمرين 29
INTERPRETING GRAPHICS: The graph below shows the size of a particular population over time. Use the graph to answer the question that follows.
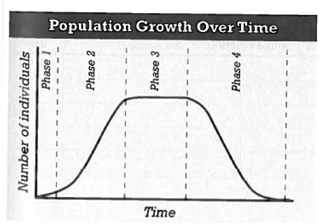
In the graph, which time period shows negative growth of the population?
A) phase 1
B) phase 2
C) phase 3
D) phase 4
In the graph, which time period shows negative growth of the population?
A) phase 1
B) phase 2
C) phase 3
D) phase 4
التوضيح موثّق
موثّق
Growth a population is affected by sever...
Holt Modern Biology 1st Edition by John Postlethwait ,Janet Hopson
لماذا لم يعجبك هذا التمرين؟
أخرى 8 أحرف كحد أدنى و 255 حرفاً كحد أقصى
حرف 255


