
Introduction to Management Science 12th Edition by Bernard Taylor
النسخة 12الرقم المعياري الدولي: 978-0133778847Introduction to Management Science 12th Edition by Bernard Taylor
النسخة 12الرقم المعياري الدولي: 978-0133778847 تمرين 41
For the linear programming model formulated in Problem 1 and solved graphically in Problem 2:
a. Determine the sensitivity ranges for the objective function coefficients, using graphical analysis.
b. Verify the sensitivity ranges determined in (a) by using the computer.
c. Using the computer, determine the shadow prices for additional hours of production time on line 1 and line 2 and indicate whether the company would prefer additional line 1 or line 2 hours.
Problem 1
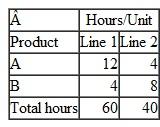
A company produces two products, A and B, which have profits of $9 and $7, respectively. Each unit of product must be processed on two assembly lines, where the required production times are as follows:
 a. Formulate a linear programming model to determine the optimal product mix that will maximize profit.
b. Transform this model into standard form.
Problem 2
Solve Problem graphically.
a. Identify the amount of unused resources (i.e., slack) at each of the graphical extreme points.
b. What would be the effect on the optimal solution if the production time on line 1 was reduced to 40 hours
c. What would be the effect on the optimal solution if the profit for product B was increased from $7 to $15 to $20
a. Determine the sensitivity ranges for the objective function coefficients, using graphical analysis.
b. Verify the sensitivity ranges determined in (a) by using the computer.
c. Using the computer, determine the shadow prices for additional hours of production time on line 1 and line 2 and indicate whether the company would prefer additional line 1 or line 2 hours.
Problem 1
A company produces two products, A and B, which have profits of $9 and $7, respectively. Each unit of product must be processed on two assembly lines, where the required production times are as follows:
a. Formulate a linear programming model to determine the optimal product mix that will maximize profit.b. Transform this model into standard form.
Problem 2
Solve Problem graphically.
a. Identify the amount of unused resources (i.e., slack) at each of the graphical extreme points.
b. What would be the effect on the optimal solution if the production time on line 1 was reduced to 40 hours
c. What would be the effect on the optimal solution if the profit for product B was increased from $7 to $15 to $20
التوضيح موثّق
موثّق
A company produces products A and B havi...
Introduction to Management Science 12th Edition by Bernard Taylor
لماذا لم يعجبك هذا التمرين؟
أخرى 8 أحرف كحد أدنى و 255 حرفاً كحد أقصى
حرف 255


