Principles of Environmental Science 8th Edition by William Cunningham,Mary Cunningham
النسخة 8الرقم المعياري الدولي: 978-0078036071Principles of Environmental Science 8th Edition by William Cunningham,Mary Cunningham
النسخة 8الرقم المعياري الدولي: 978-0078036071 تمرين 9
Explain how climate graphs (as in fig. 5.6) should be read.
FIGURE 5.6: Moisture availability depends on temperature as well as precipitation. The horizontal axis on these climate diagrams shows months of the year; vertical axes show temperature ( left side ) and precipitation ( right ). The number of dry months (shaded yellow) and wetter months (blue) varies with geographic location. Yearly annual temperature (°C) and precipitation (mm) are shown at the top of each graph.
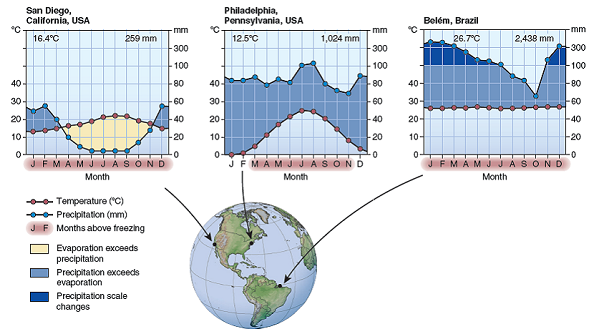
FIGURE 5.6: Moisture availability depends on temperature as well as precipitation. The horizontal axis on these climate diagrams shows months of the year; vertical axes show temperature ( left side ) and precipitation ( right ). The number of dry months (shaded yellow) and wetter months (blue) varies with geographic location. Yearly annual temperature (°C) and precipitation (mm) are shown at the top of each graph.
التوضيح موثّق
موثّق
Dependency ratio:
Explanation
The ratio...
Principles of Environmental Science 8th Edition by William Cunningham,Mary Cunningham
لماذا لم يعجبك هذا التمرين؟
أخرى 8 أحرف كحد أدنى و 255 حرفاً كحد أقصى
حرف 255


