
Macroeconomics 12th Edition by Rudiger Dornbusch ,Stanley Fischer,Richard Startz
النسخة 12الرقم المعياري الدولي: 978-1259070969Macroeconomics 12th Edition by Rudiger Dornbusch ,Stanley Fischer,Richard Startz
النسخة 12الرقم المعياري الدولي: 978-1259070969 تمرين 1
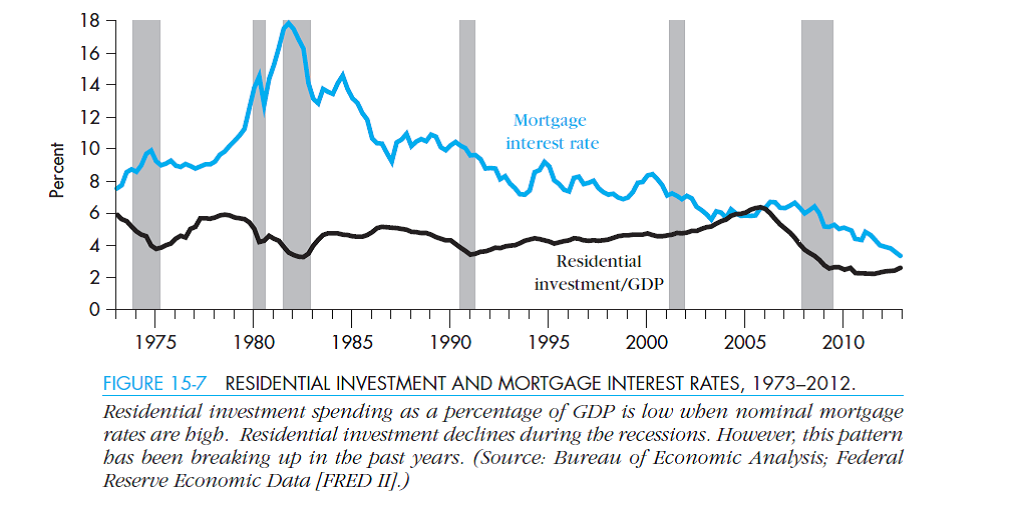
Figure 15-7 illustrates the relationship between mortgage interest rates and the share of residential investment in GDP. Another way of looking at the same relationship is to take housing starts instead of the share of residential investment.
a. Go to http://research.stlouisfed.org/fred2. Click on "Categories," under "Money, Banking, Finance" select "Interest Rates" then "Mortgage Rates," and download the series "MORTG" for 30-year conventional mortgage rates. Go to www.census.gov. Click on "Housing," then on "Construction" under "Related Sites for Housing Data." Next to "Housing Starts," choose the seasonally adjusted annual rate and download the data.
b. Using EXCEL, create a graph that includes both the mortgage interest rates and the housing starts. Visually, what is the relationship between these two variables
التوضيح موثّق
موثّق
a. If the net present discounted value (...
Macroeconomics 12th Edition by Rudiger Dornbusch ,Stanley Fischer,Richard Startz
لماذا لم يعجبك هذا التمرين؟
أخرى 8 أحرف كحد أدنى و 255 حرفاً كحد أقصى
حرف 255


